- Meridian Compass
- Posts
- Weekly Market Review: August 12, 2025
Weekly Market Review: August 12, 2025
Real-World Trading Insight. No Hype, Just Edge.
mark schaefer
August 12, 2025
In This Issue:
Last week's analysis delivered 6,070 points from crypto and 470 points across FX
Reading conflicting timeframes - when daily structure overrides intraday signals
Position sizing reality: Why the 2% rule fails in correlated markets
Key levels for the week ahead
When Pattern Recognition Delivers
Last week's analysis delivered strong results: 6,070 points from crypto and 470 points across FX markets. Several key levels were flagged in advance, while others developed in real time.
The BTC support level at 113k was highlighted in last week's letter, noting the confluence of trendline support and lower Bollinger band. The market respected this level precisely, rallying from 113k to 119,103.

BTC
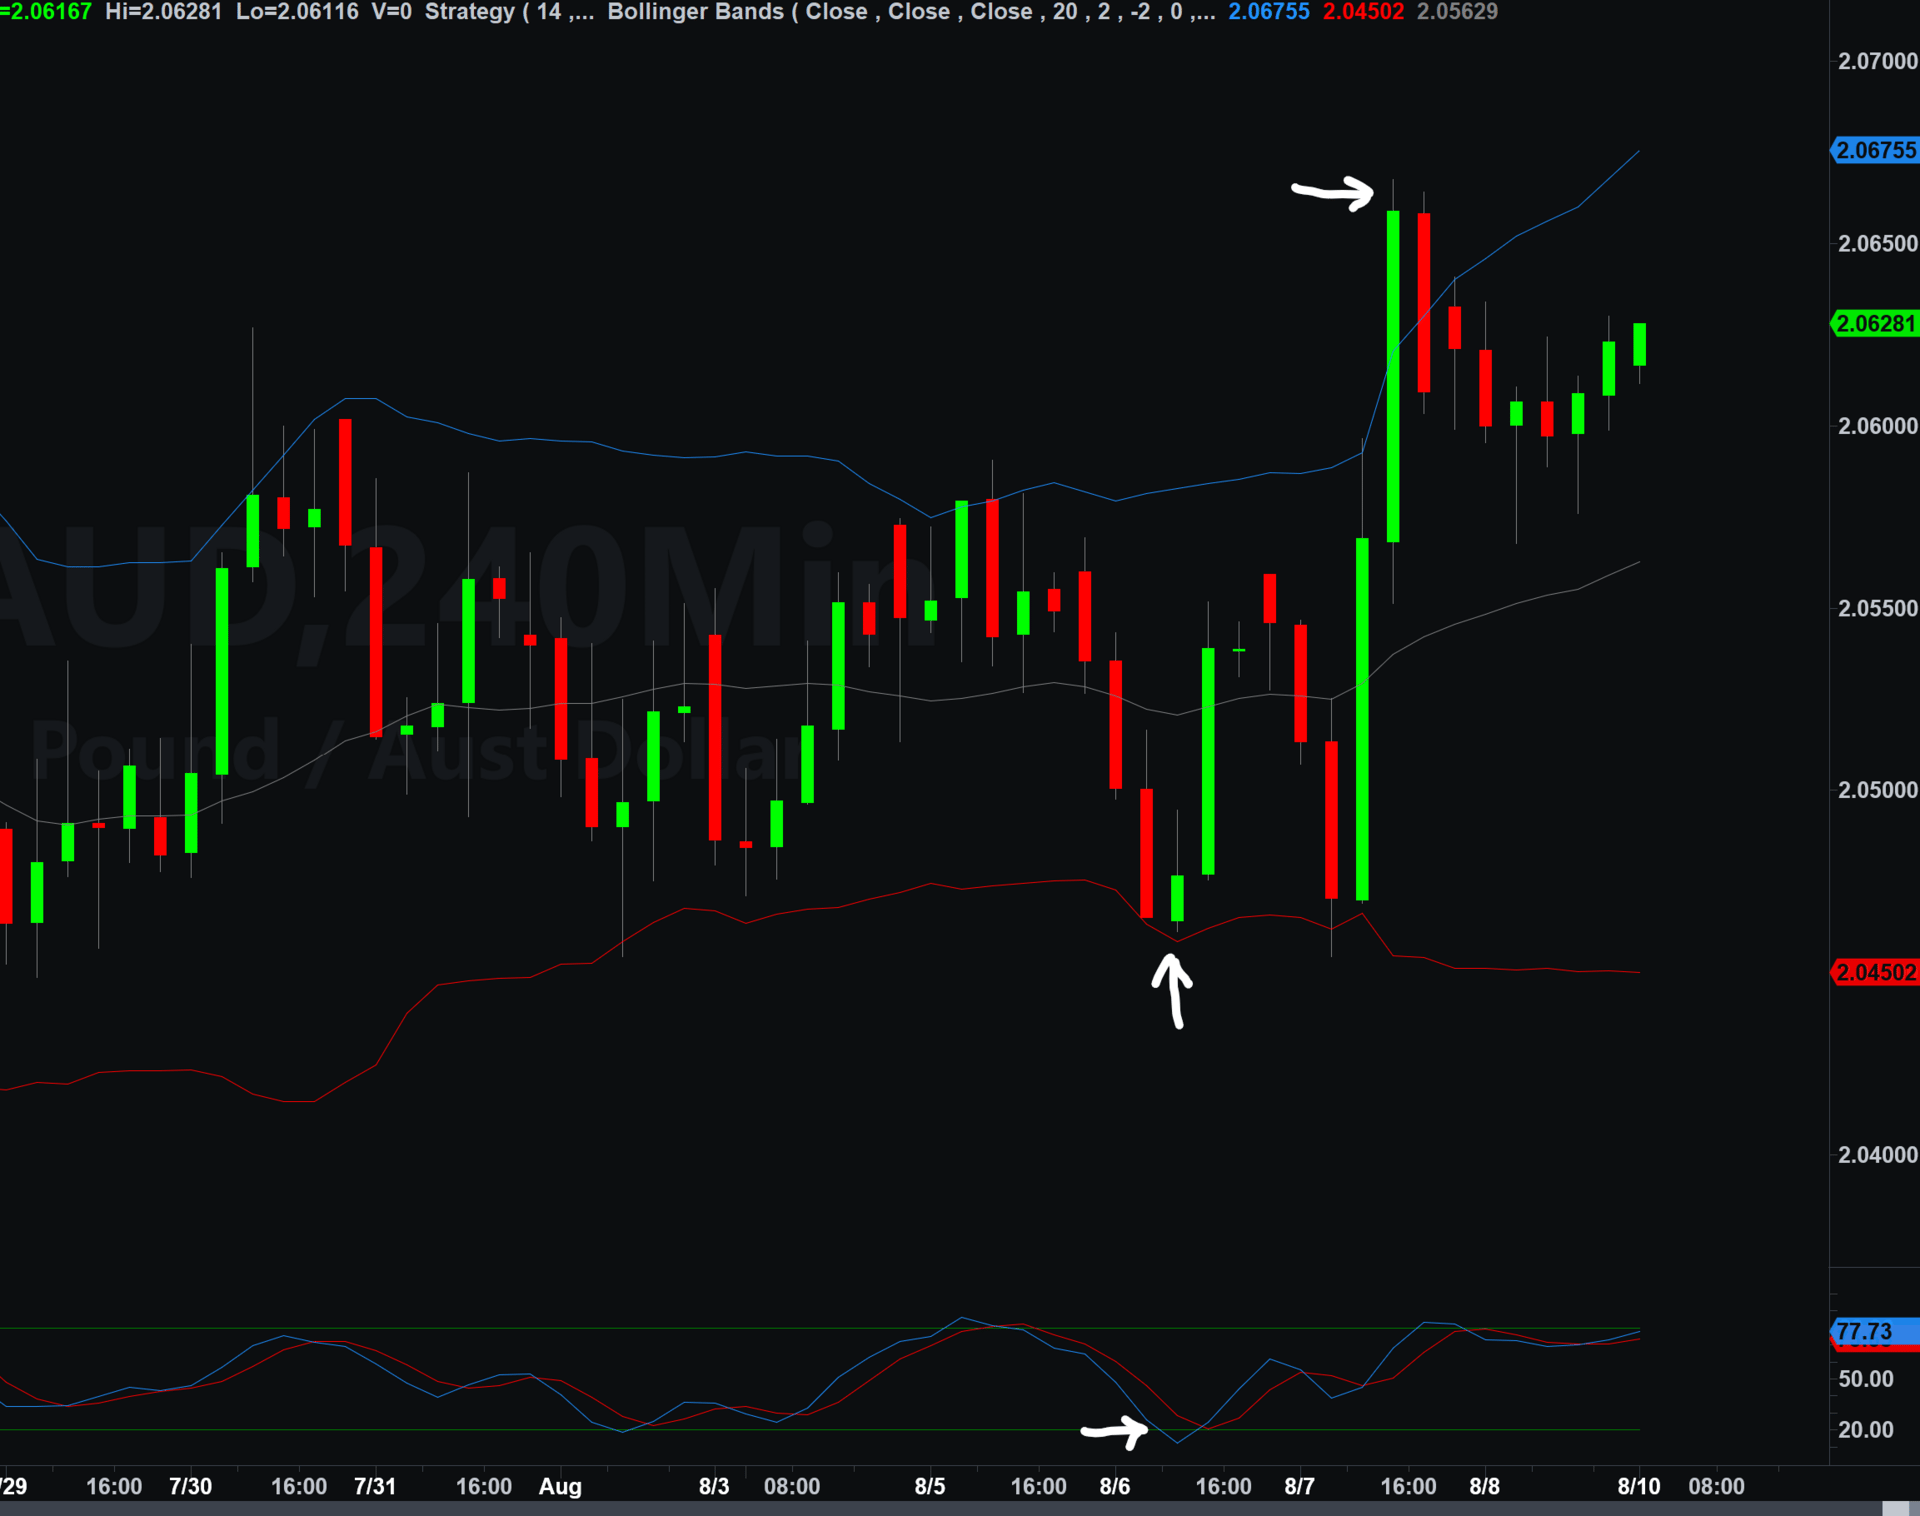
GBP/AUD
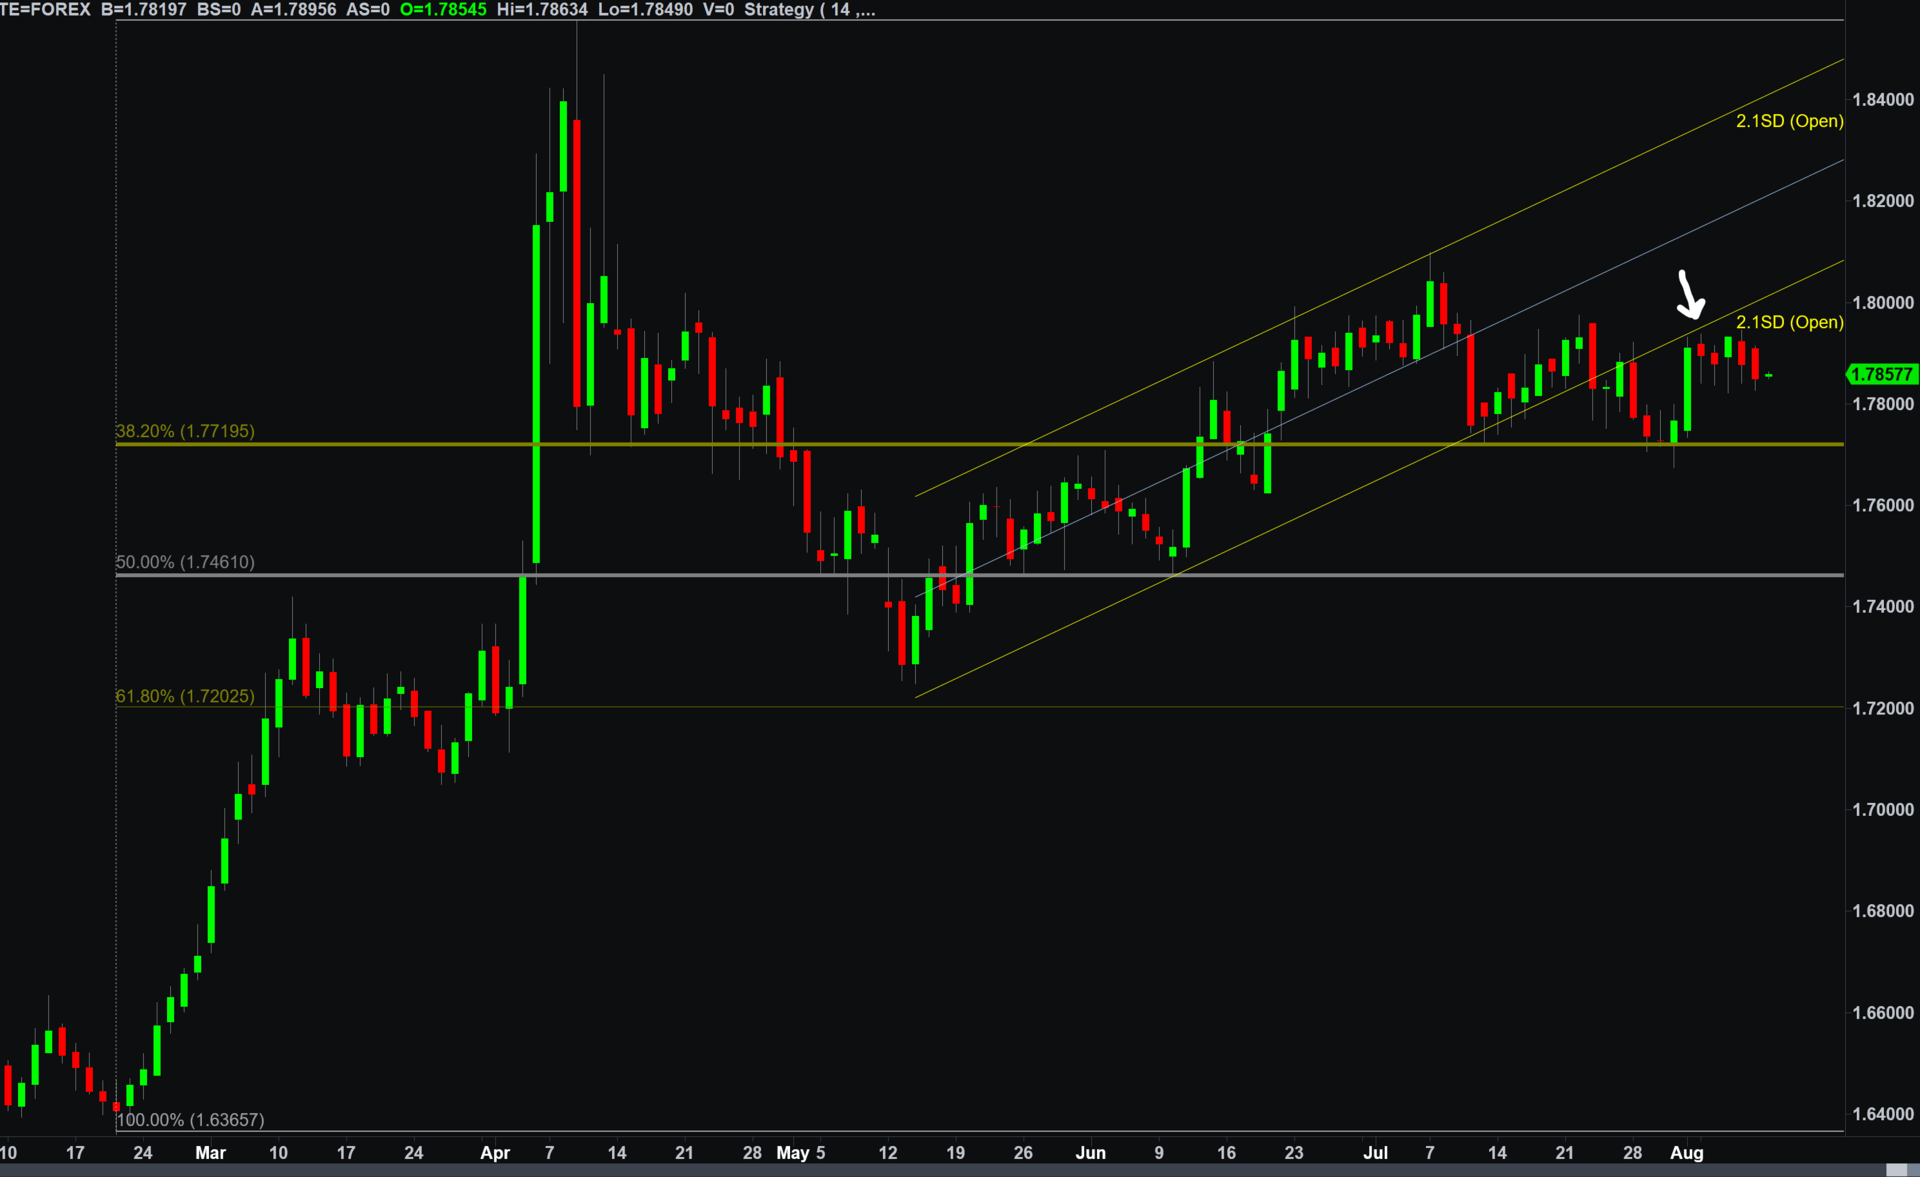
EUR/AUD
This Week's Results
BTC Support at 113k: Flagged level respected → rally from 113k to 119,103 → +6,103 points
GBP/AUD Bullish Reversal: Lower Bollinger band + oversold momentum at 2.0480 → rally to 2.0667 → +187 points
EUR/AUD: Trendline resistance at 1.7945 → rejection at 1.7938, drop to 1.7826 → +111 points
EUR/USD Fibonacci Support: 1.1518 level held → rally to 1.1699 → +172 points
ETH 4-Hour Pattern: Conflicting timeframe signals → reduced position size → minimal loss
Note: These measure market reactions from flagged levels, not trading results. Implementation varies by individual approach.
Reading Conflicting Timeframes
ETH presented conflicting signals this week - a textbook example of why timeframe analysis matters.
The Setup:
4-hour timeframe: Bearish reversal pattern developing at 3,816
Daily timeframe: Underlying structure still favoring higher prices
Resolution: Daily structure prevailed, 4-hour signal failed
When timeframes conflict, there are three options:
Wait for alignment across multiple timeframes before entering
Reduce position size to account for uncertainty
Skip the setup entirely if conviction isn't there
Example: Standard 2% risk with 50-pip stop becomes 1% risk with same 50-pip stop when timeframes disagree. Smaller position, same invalidation level.
The Hidden Risk in "Diversification"
After 30+ years managing institutional FX strategies, I've watched intelligent traders blow up accounts on what they thought was diversified risk.
The classic mistake: Taking 2% risk on EUR/USD, 2% on GBP/USD, and 2% on AUD/USD simultaneously.
The reality: These pairs move together 70-80% of the time. You're not taking three 2% risks - you're taking one 6% risk on the same directional bet.
Correlation Risk Management
Scale position sizing based on correlation levels:
High correlation (0.7+): Treat multiple positions as single exposure
Moderate correlation (0.4-0.69): Reduce individual position sizes by 30-50%
Low correlation (<0.4): Standard position sizing applies
Understanding correlation risk can make the difference between controlled risk and unexpected blowups.
Key Levels for the Week Ahead
FX Majors
EUR/USD: Critical resistance at 1.1664 - the 61.8% retracement from July's decline. Momentum approaching overbought territory.
EUR/AUD: Channel resistance comes in at 1.8010. Support at 1.7720 (38.2% Fibonacci) - level that held two weeks ago.
GBP/AUD: Lower channel support at 2.0490 continues to hold. Price has tested this level 13 times in 20 sessions but closed below only twice.
USD Index: Key resistance at 98.60/65 - former pivot high and 38% retracement. Above that targets 98.90 (50% Fibonacci). Downside support at 96.86.
Crypto
BTC: Market approaching overbought territory near 122k. Key retracement levels at 117,119 (50% Fibonacci) and 115,895 (61.8% Fibonacci). Watch for break above 123,205 high - could signal final push before healthy correction. Not calling the top yet, but watching for eventual pullback to 115k-117k zone.
Community Growth
Thanks for reading! If you found value this week, feel free to share with fellow traders. You can also follow @schaef45809 on X for real-time updates.
Meridian Compass Pro Coming Soon
Want to learn how to:
Spot divergences before they become obvious?
Use multi-timeframe analysis for stronger signals?
Consistently size positions with proper risk?
Use Fibonacci for retracements and targets?
Know when to sit on the sidelines?
What I'd cover: 30+ years of institutional risk management and market structure reading.
Interested?
Reply to this email with 'PRO' to be added to the early access list.
Questions? Feedback? Reply to this email—I read every response.
Meridian Compass is brought to you by Mark Schaefer, a quantitative portfolio manager with over 30 years experience developing and trading systematic strategies in global futures and FX at major banks and hedge funds.
IMPORTANT DISCLAIMER