- Meridian Compass
- Posts
- The week in FX: August 5, 2025
The week in FX: August 5, 2025
Real-World Trading Insight. No Hype, Just Edge.
mark schaefer
August 05, 2025

In This Issue:
Divergence setups across FX & crypto that stood out this week
ETH, BTC, and key FX levels — how the signals developed
USD trend update: corrective bounce vs. bigger reversal
Key levels I’m watching for the week ahead
When Pattern Recognition Delivers
Last week’s letter highlighted several key levels that played out as expected. At the same time, some of the biggest signals (BTC and ETH) developed in real time. Those weren’t in the letter, but they show why it’s important to track both the setups mapped out in advance and the ones that emerge as conditions shift.
The week delivered 5,440 points from crypto setups and 489+ points across FX.
This week, divergence stood out as the most powerful signal type, with clean setups and market reactions that matched the volatility environment in each pair.
ETH Bearish Divergence +440 Points
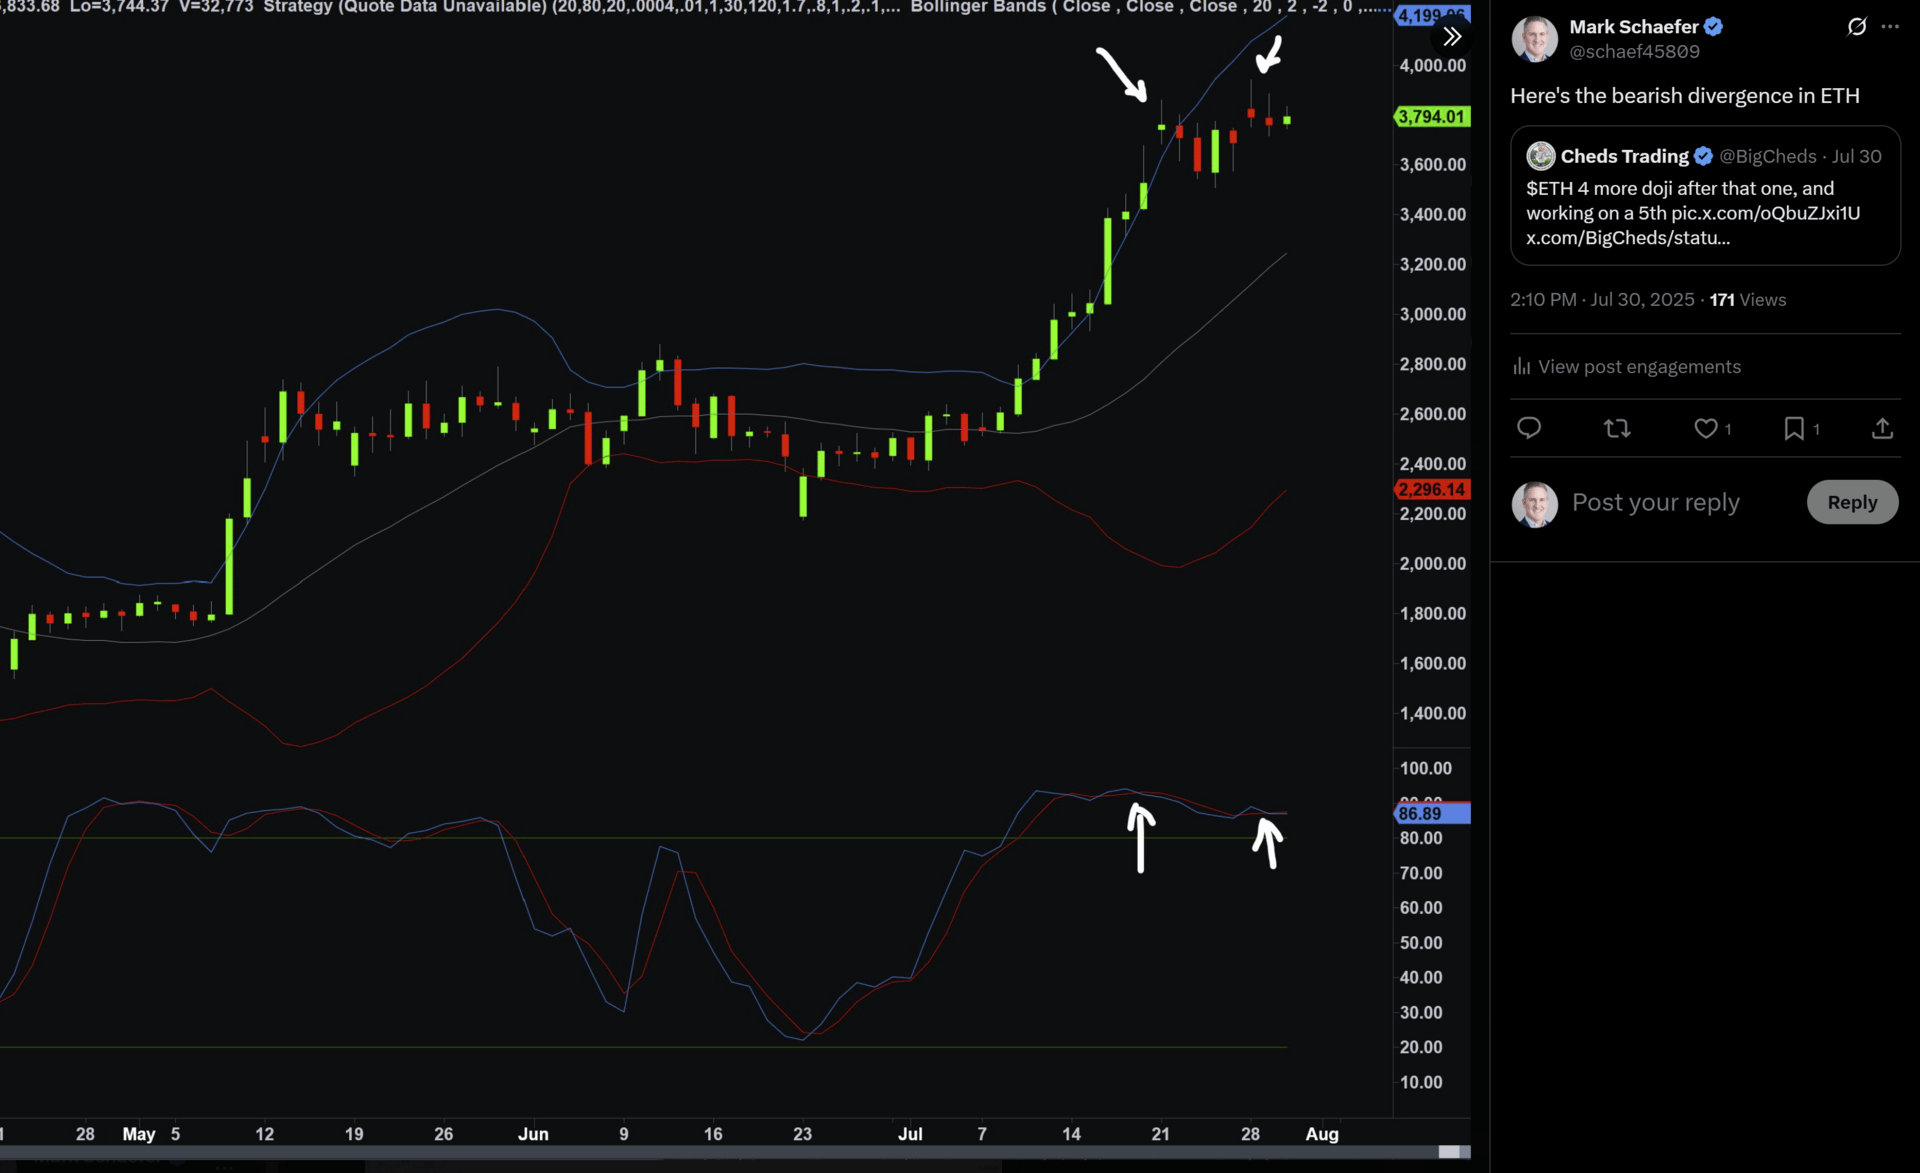
ETH
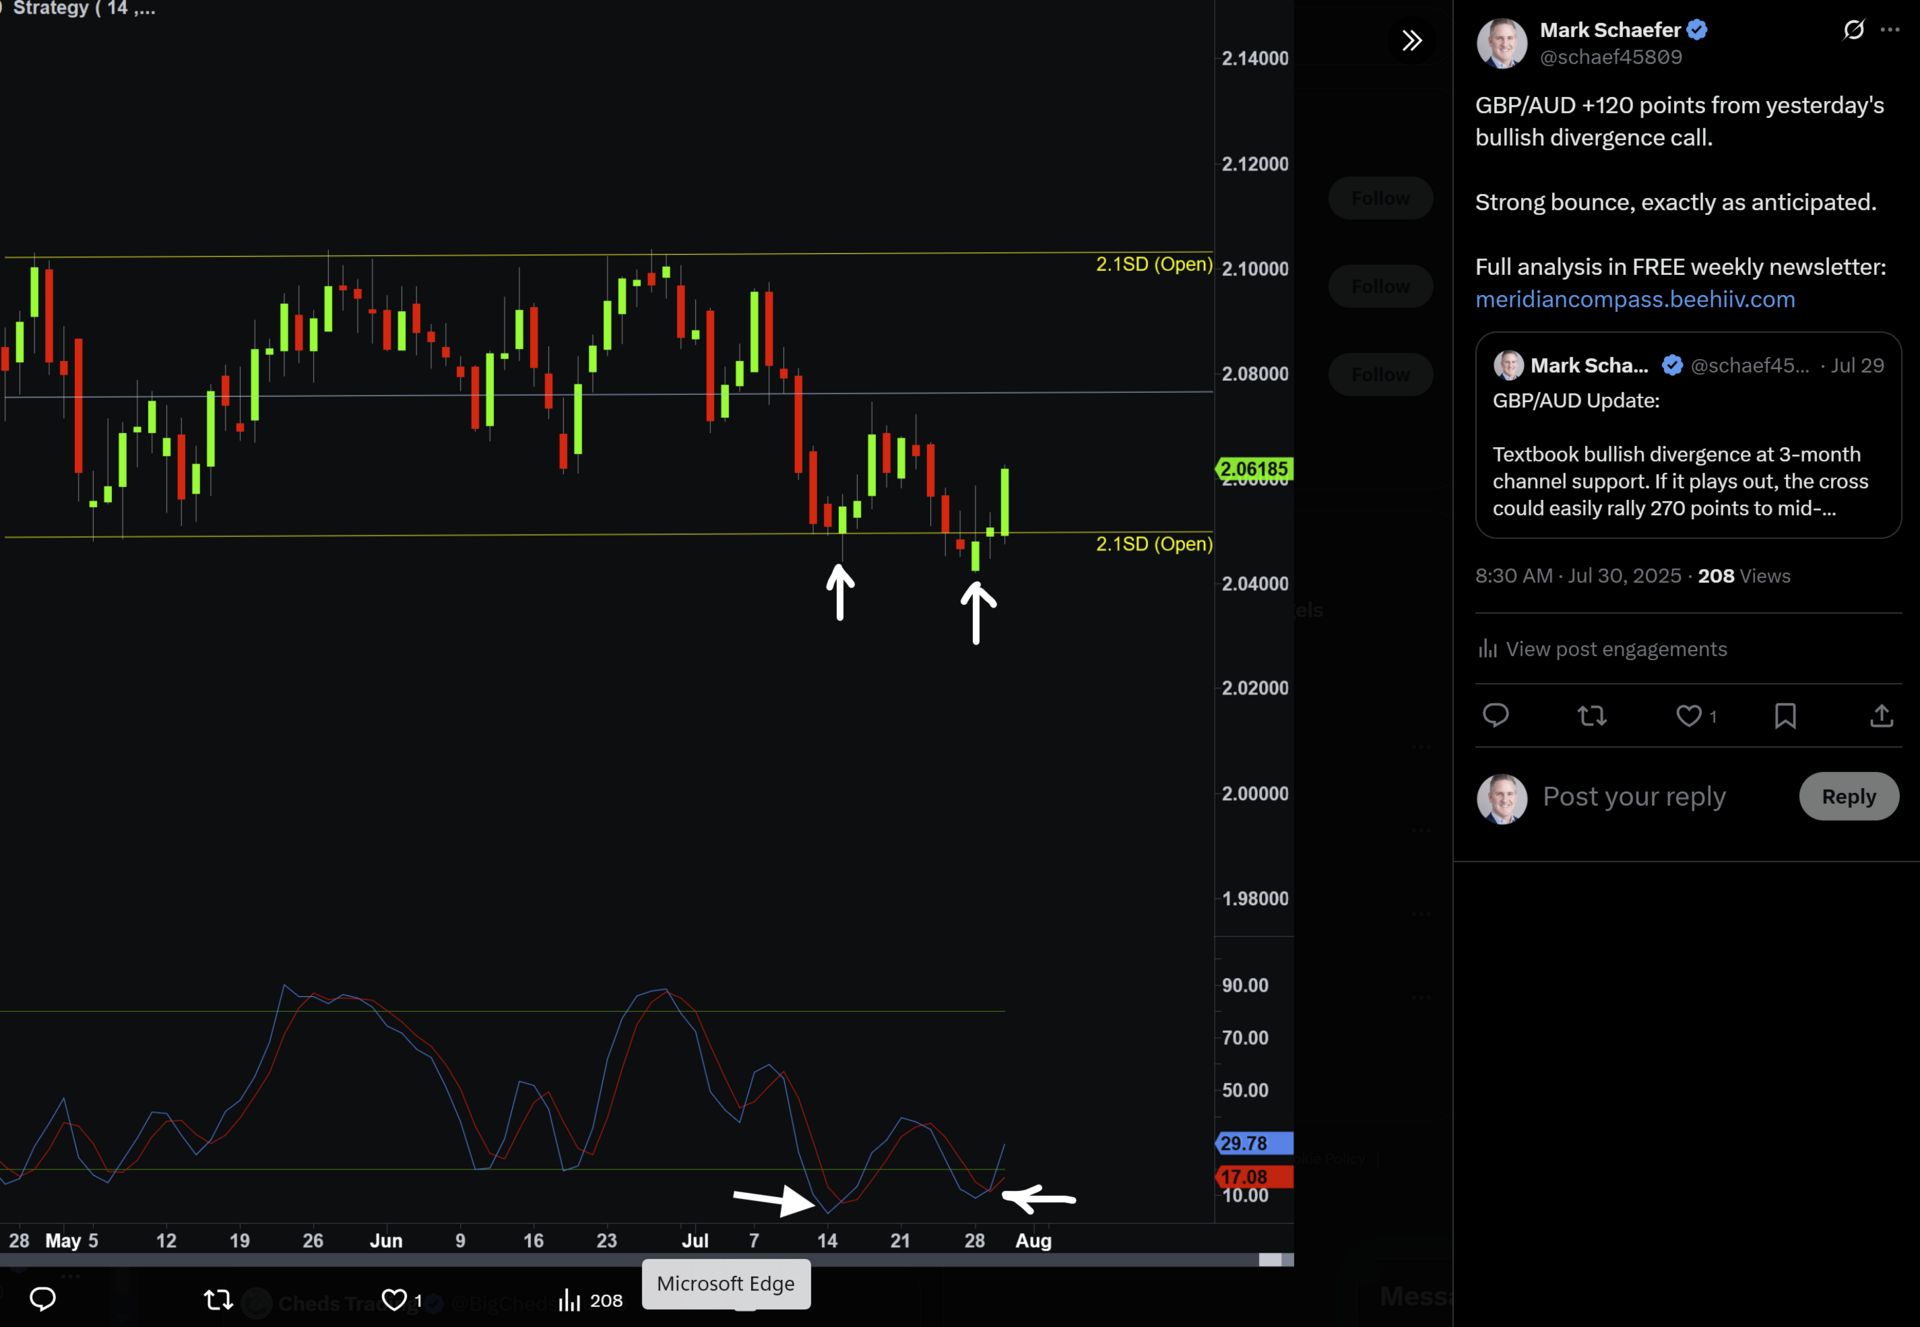
GBP/AUD Bullish Divergence +119 Points
EUR/USD Bullish Divergence +31 Points

This Week's Results
BTC Bearish Engulfing: 4-hour pattern at 117k → 112k → +5,000 points
ETH Bearish Divergence: Daily divergence at 3,794 → 3,354 → +440 points
EUR/AUD Channel Break: 3-month channel break and retest → +200 points
GBP/AUD Bullish Divergence: Channel support 2.0507 → 2.0626 in 24hrs → +119 points
USD Index 98.66: Pivot break → short covering to 100.05 → +139 points
EUR/USD Bullish Divergence: 1.0541 → 1.0572 → +31 points
Note: These measure market reactions from flagged levels, not trading results. Implementation varies by individual approach.
Reading the Key Levels
Take USD Index 98.66 - simply the pivot high after a two-week relief rally. Once established, it became the natural reference point. Break above = short covering pressure. Nothing complicated.
You identify these inflection points and watch how price reacts. These are where people leave orders to cover shorts, enter new positions, capture momentum. It's about precision instead of guessing.
EUR/AUD is another example. We'd been tracking this channel for months - price respecting the structure until it finally broke. Classic acceleration on the downside when months of support fails.
I'll be honest - divergence is one of my favorite patterns. When markets approach new highs/lows, you immediately check if momentum matches. The greater the disconnect, the stronger the signal. Price says one thing, momentum says another.
USD: The Bigger Picture
EUR/USD took a beating last week, dropping over 300 points before recovering half after that disappointing jobs number. But the bigger USD story hasn't changed - it's still in a downtrend.
The Fed's probably going to cut rates, there's political uncertainty everywhere, trade tensions keep escalating, and people are moving away from USD assets. The dollar bounce was overdue, but 101.05 on the USD Index is still the key level - that's the first major Fibonacci retracement.
Key Levels To Watch
Here's what I'm watching for the week ahead - these are the levels where market structure suggests we could see significant reactions.
FX Majors
EUR/AUD: Approaching the 1.7945 trendline retest - this is the upward sloping line it broke below. Former support now becomes resistance. Watch for rejection here.
EUR/USD: Key retracement levels at 1.1518 (38% Fibonacci) and 1.1494 (50% Fibonacci). Expecting shallow pullbacks given the underlying USD weakness theme we've been tracking.
USD Index has resistance at 99.23 and 99.42, but the big level is still 101.05 - that's where this bounce gets serious. Support down at 98.04 and 97.56.
GBP/NZD: Watching 2.2265 for 3-month channel support. This level has held multiple times - break below would signal deeper correction.
Crypto
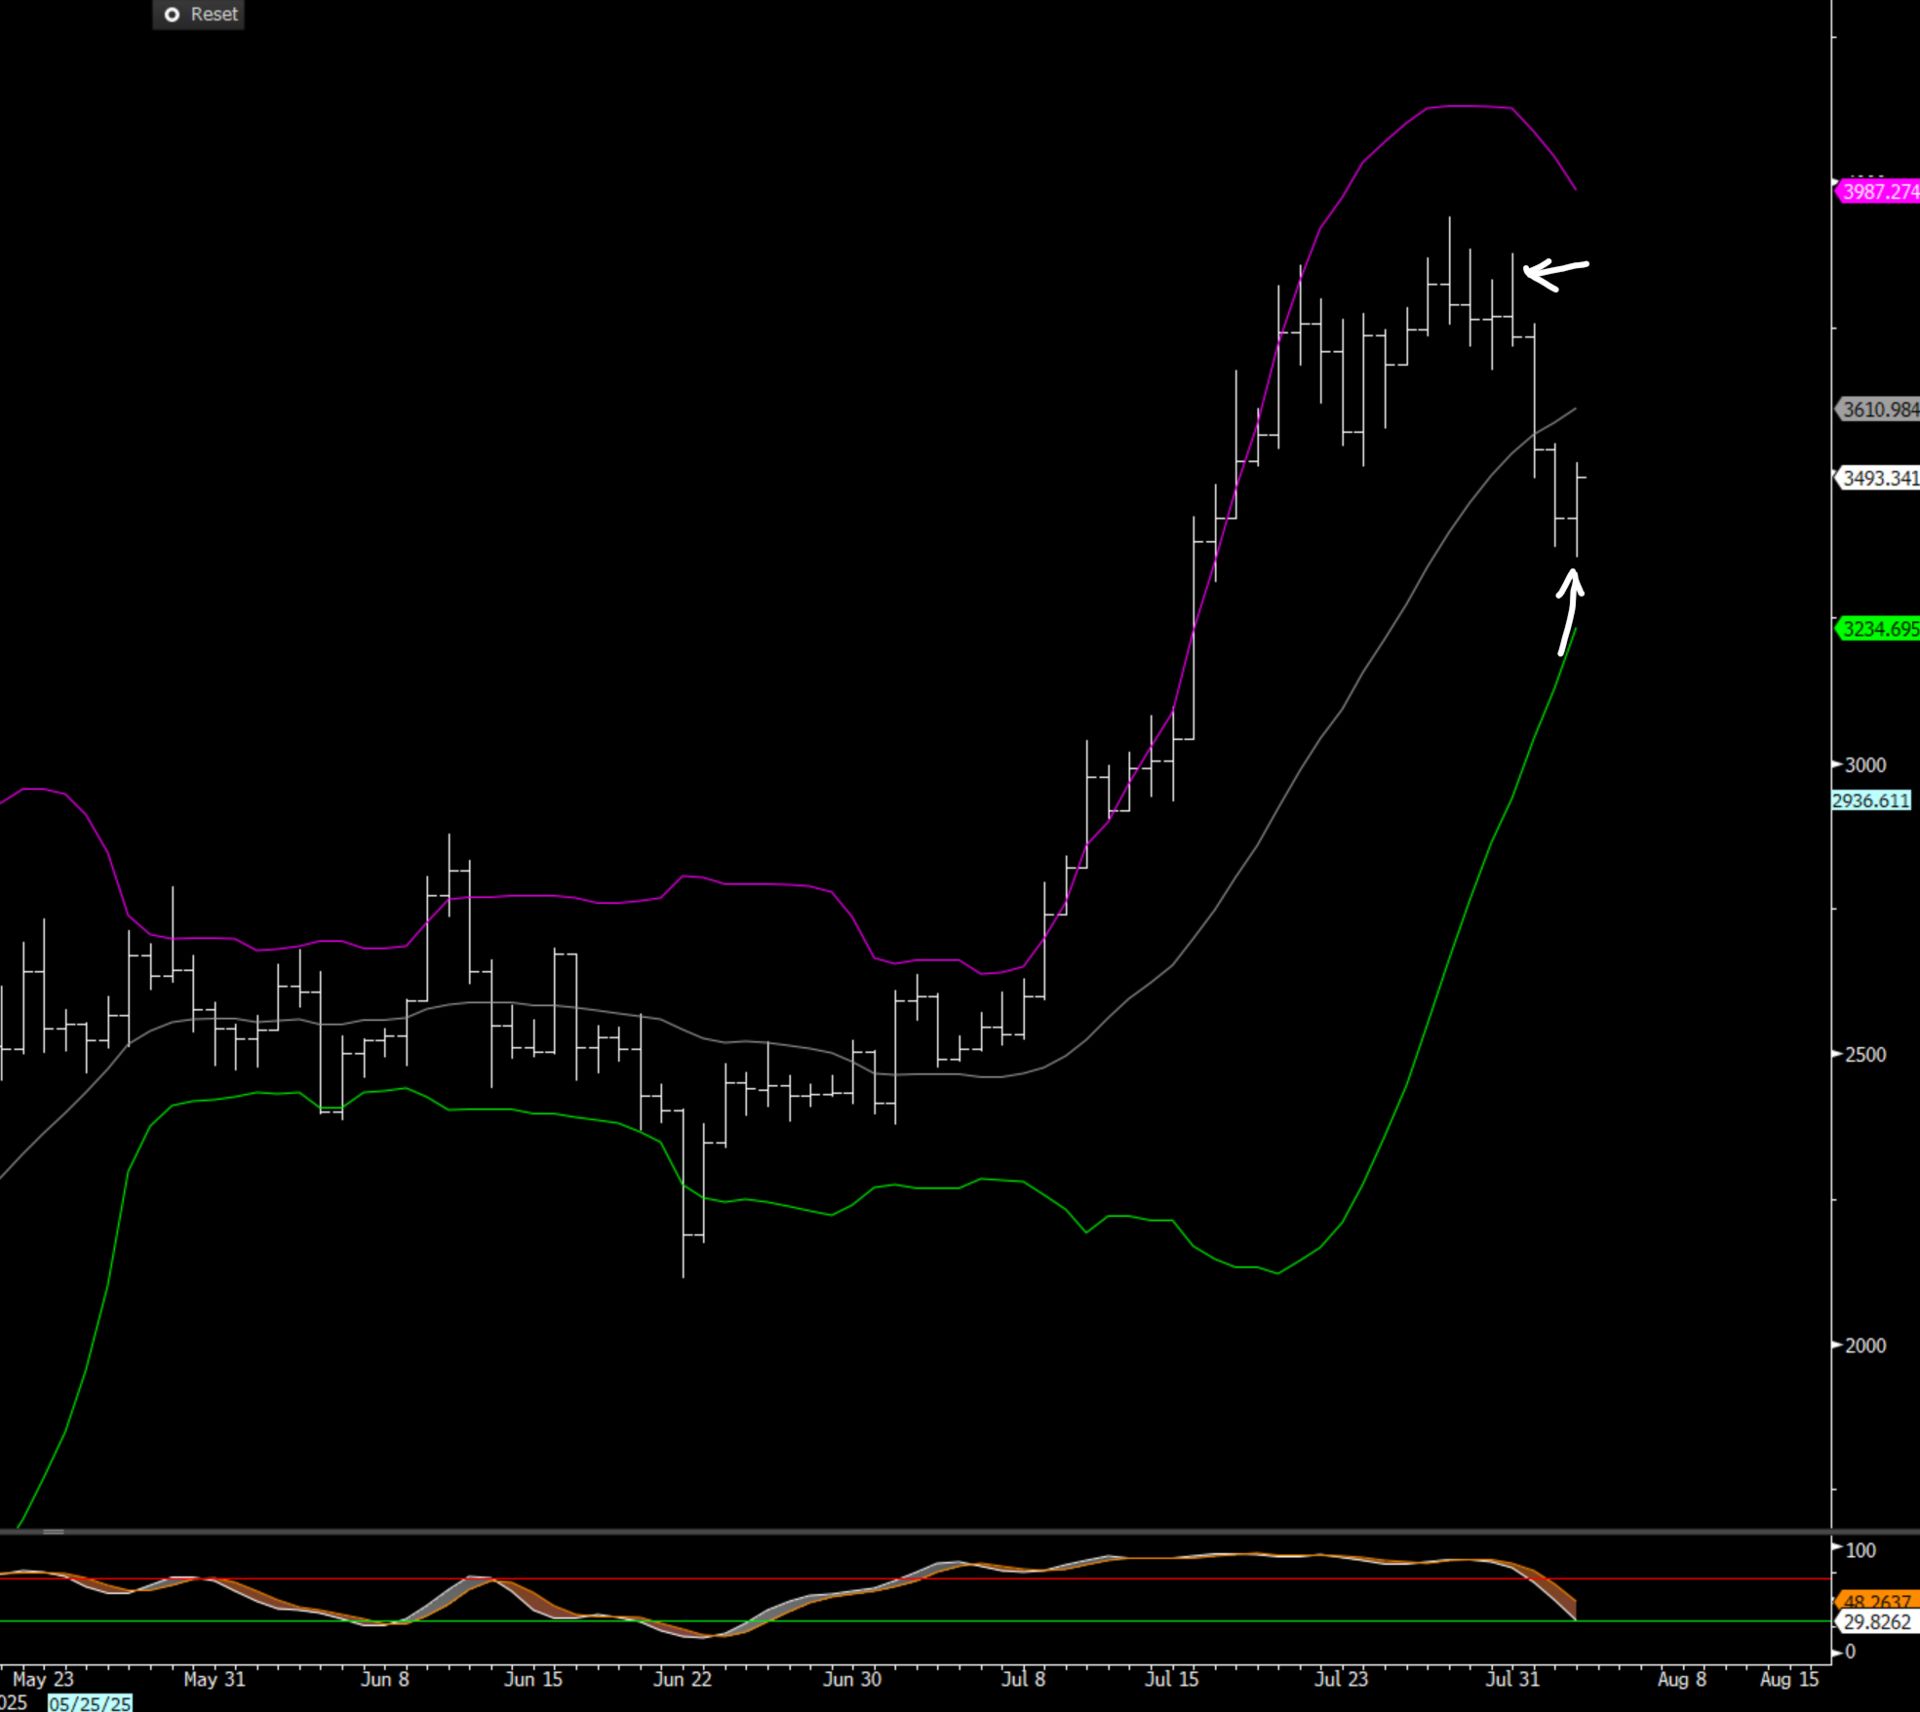
BTC: Finding support around 113k with the trendline and lower Bollinger band. Sunday's bullish engulfing could push it back to 120k, but a break below opens the door to 104k, then 98k.
ETH: Bullish reversal off the Sunday's low at 3355. Trading middle of the range. A break below Sunday's low opens the door to test the 38% retracement at 2966
Community Growth
Thanks for reading! If you found value this week, feel free to share with fellow traders. You can also follow @schaef45809 on X for real-time updates.
🔥 Meridian Compass Pro Coming Soon
Want to learn how to:
Use multi-timeframe analysis for stronger signals?
Spot divergences before they become obvious?
Consistently size positions with proper risk?
Use Fibonacci for retracements and targets?
Know when to sit on the sidelines?
What I'd cover: 30+ years of institutional risk management and market structure reading.
Interested?
Reply to this email with 'PRO' to be added to the early access list.
Questions? Feedback? Reply to this email—I read every response.
Meridian Compass is brought to you by Mark Schaefer, a quantitative portfolio manager with over 30 years of experience developing and trading systematic strategies in global futures and FX at major banks and hedge funds.
IMPORTANT DISCLAIMER